Page 96 - WEF Reoprt 2020
P. 96

Completion thresholds


            We received 1,047 total responses to the GRPS to   –  Part 2 “Assessment of Global Risks”:
            which we applied an overall standard deviation check, as   The answers from the 718 respondents who
            well as specific completion thresholds for each section   assessed the impact and likelihood of at least
            of the survey:                                         one risk were used to compute the results (leaving
                                                                   the question entirely blank was not considered a
            –  Overall: nine responses yielded a standard          valid answer).
                deviation of zero in the increase/decrease scores
                for Part 1 of the survey, as well as the likelihood   –  Part 3 “Global Risk Interconnections”: The
                and impact scores for Part 2. These responses      answers from the 628 respondents who selected
                were not included in the survey results.           at least one valid pair of risks were used to
                                                                   compute the results.
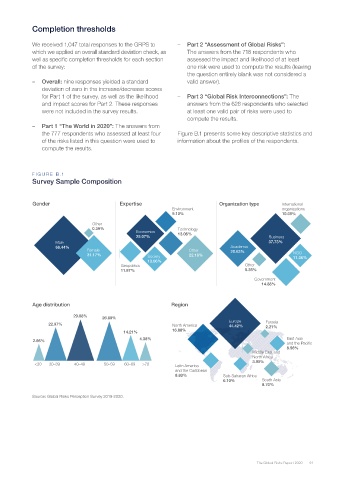
            –  Part 1 “The World in 2020”: The answers from
                the 777 respondents who assessed at least four   Figure B.1 presents some key descriptive statistics and
                of the risks listed in this question were used to   information about the profiles of the respondents.
                compute the results.


            F I G URE  B .1
            Survey Sample Composition


            Gender                         Expertise                          Organization type     International
                                                              Environment                           organizations
                                                              9.10%                                 10.05%
                                 Other
                                 0.39%                          Technology
                                                 Economics
                                                 25.07%         13.06%                         Business
                     Male                                                                      37.73%
                     68.44%                                                       Academia
                                Female                             Other          20.63%
                                31.17%               Society       22.16%                               NGO
                                                                                                        11.36%
                                                     13.06%
                                           Geopolitics                                 Other
                                           11.87%                                      5.35%
                                                                                          Government
                                                                                             14.88%


            Age distribution                                 Region
                           29.08%    26.69%
                  22.97%                                      North America      Europe       Eurasia
                                                                                 44.42%
                                                                                              2.21%
                                            14.21%            16.88%
             2.66%                                4.38%                                               East Asia
                                                                                                      and the Pacific
                                                                                                      8.96%
                                                                                          Middle East and
                                                                                          North Africa
             <30  30–39    40–49      50–59  60–69  >70        Latin America              3.90%
                                                               and the Caribbean
                                                               8.83%           Sub-Saharan Africa
                                                                               6.10%         South Asia
                                                                                             8.70%
            Source: Global Risks Perception Survey 2019-2020.


                                                                                           The Global Risks Report 2020  91
   91   92   93   94   95   96   97   98   99   100   101